Data visualization is a graphical representation of information and data. By using visual elements like charts, graphs, and maps, data visualization tools provide an accessible way to see and understand trends, outliers, and patterns in data.
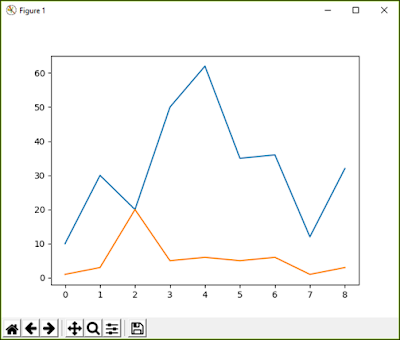
Below is an example of a line chart, these charts can be prepared using pyplot interface of matplotlib library in Python.
 |
| Line Chart |
- Purpose of Plotting
- matplotlib library
- Installing matplotlib in Python
- pyplot interface
- Different types of graphs in the syllabus of CBSE Class 12 Informatics Practices
Purpose of Plotting
The plotting means generating graphs from available data. We can generate different graphs in Python by using different libraries available in it.
Python supports 2D Graphs and 3D Graphs, there are different libraries available in Python for this purpose. According to CBSE Class 12 IP, you need to learn on 2D Plotting.
Following are the main purposes due to which Plotting is more important than raw data:
- Using Graphs pattern in data can be understood easily.
- Large data can be easily represented by using a small Graph.
- In any organization, decision making is the most important. For taking decision Graphical representation of data is used.
- Same data can be represented by different types of graphs, so all the aspects of data can be summarized.
- Using Graphical plotting, comparative analysis can be done very easily.
- Since Graphical representation of data involves figures, lines or bars; there is a less chance of error and mistake.
Since python provides various libraries to develop graphs from a large data set, we can develop many types of graphs very easily.
There are multiple tools available for performing visualization in data science. In Python, we can use exclusive libraries for visualization, commonly known as matplotlib.
"matplotlib" library in Python
The python-based plotting library offers matplotlib with a complete 2D support along with limited 3D graphic support. It is useful in producing publication-quality figures in the interactive environment across platforms. It can also be used for animations as well. pyplot interface of matplotlib is used for representing 2D graphs, which we are going to cover in our syllabus.
Installing matplotlib (in Windows Python)
Run the following commands, internet connection is required for installing the matplotlib library.
Run the following commands, internet connection is required for installing the matplotlib library.
- Open cmd.
- run command
python –m pip install matplotlib
pyplot interface in python
pyplot is a collection of command style functions that are used for Data Visualization. It is available inside matplotlib. pyplot interface provides many methods for 2D plotting of Data. Ex:- plot( ), bar( ), pie( ) etc.
To use pyplot we have to import it by using:
import matplotlib.pyplot as plt
Here plt is an alias, instead of plt you can use any name.
Multiple types of graphs can be plotted using pyplot ex:- line chart, bar chart, pie chart, scattered chart, histogram, box plot etc.
Different types of graphs in the syllabus of CBSE Class 12 Informatics Practices
There are three different types of graphs in your syllabus that we are going to discuss:
- Line Chart:- Line chart or Line graph is a type of chart which displays information as a series of data points called ‘markers’ connected by a straight line segment.

Line Chart - Bar Chart:- A diagram in which the numerical values of variables are represented by the height or length of lines or rectangles.

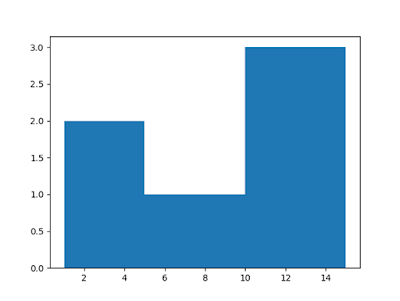
Bar Chart - Histogram:- A histogram is a graphical display of data using bars of different heights. In a histogram, each bar groups numbers into ranges. Taller bars show that more data falls in that range.

Histogram
For more details watch the video:


No comments:
Post a Comment