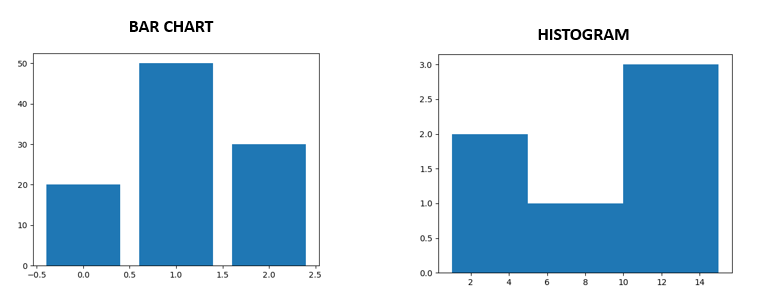
- Taller bars show that more data falls in that range.
- hist( ) function is used for generating histogram in Pyplot.
Difference Between Bar Chart and Histogram
Use of Histogram (by an example)
1 2 3 4 5 6 7 | import matplotlib.pyplot as plt n = [1,4,7,12,13,15] plt.hist(n, bins=[1,5,10,15]) plt.show() ## Note: By default the bins will be divided automatically. ## Python checks the lowest and highest values from the given numbers and divide in the equal size bins. |
hist( ) function Prototype
<matplotlib.pyplot>.hist(x, bins = None, cumulative = Flase, histtype = 'bar', align = 'mid', orientation= 'vertical')
X: Array or sequence of arrays to be plotted on Histogram
bins: an integer or sequence, used to divide the range in the histogram
cumulative: True or False, Default is False
histtype: {'bar', 'barstacked', 'step', 'stepfilled'}, Default 'bar'
align: {'left', 'mid', 'right'}, default is 'mid'
orientation: {'horizontal', 'vertical'}, Default 'horizontal'
Explanation of Different parameters:
- X (Data): Array or sequence of arrays to be plotted on Histogram
- a) Single ArrayFind the output of the above program, all the bucket or bins taken by the Python by default.
1
2
3
4
import matplotlib.pyplot as plt
l = [1,4,7,12,13,15]
plt.hist(l)
plt.show()
- b) Tow or more than two arrays Since in the above program, we are providing two sequences here the Python will generated two histograms as below:
1
2
3
4
5
import matplotlib.pyplot as plt
a = [1,4,7,12,13,15]
b = [10,14,17,2,3,11]
plt.hist([a,b])
plt.show()
- bins: an integer or sequence, used to divide the range in the histogram
- a) Automatic bins: In the previous two examples you can see that I have not given bins parameter. Bin is dividing automatically.
- b) Giving the bins Manually
i) Using Scalar ValueYou can see I have given bins as 5, hence python will create 5 bins of equal size.1 2 3 4
import matplotlib.pyplot as plt a = [1,4,7,12,13,15] plt.hist(a, bins=5) plt.show()
ii) Using listIn the above program, since we are giving bins as a list, hence now bins will be 1-5,5-10 and 10-15.1 2 3 4
import matplotlib.pyplot as plt a = [1,4,7,12,13,15] plt.hist(a, bins=[1,5,10,15]) plt.show()
- cumulative: To make a cumulative histogram, by default it is False
Cumulative mean accumulating the previous height of the bar, It can be either True or False, default is False. Till now we have seen all histogram with a default value of cumulative, that is with False. If we make the value of cumulative as True for the previous example: 1 2 3 4 | import matplotlib.pyplot as plt a = [1,4,7,12,13,15] plt.hist(a, bins=[1,5,10,15], cumulative=True) plt.show() |
- histtype: This gives the style to the histogram.
- 'bar' [Defaut]
- 'barstacked': Used when providing two or more arrays as data
- 'step': generate a line plot that is by default unfilled
- 'stepfilled': generate a filled line plot
1 2 3 4 5 6 7 8 9 10 11 12 13 14 15 16 17 18 19 20 21 22 | import matplotlib.pyplot as plt a = [1,4,7,12,13,15] b = [11,14,17,2,3,12] plt.subplot(2,2,1) plt.hist(a, bins=[1,5,10,15], histtype='bar') plt.title("bar") ##barstacked is used with two or more data arrays plt.subplot(2,2,2) plt.hist([a,b], bins=[1,5,10,15], histtype='barstacked') plt.title("barstacked") plt.subplot(2,2,3) plt.hist(a, bins=[1,5,10,15], histtype='step') plt.title("step") plt.subplot(2,2,4) plt.hist(a, bins=[1,5,10,15], histtype='stepfilled') plt.title("stepfilled") plt.show() |
- align: Used for Histogram bars alignment{'left', 'mid', 'right'}, default is 'mid'
It is used for bar alignment, consider the following code which is using all types of alignments. 1 2 3 4 5 6 7 8 9 10 11 12 13 14 15 | import matplotlib.pyplot as plt a = [1,4,7,12,13,15] plt.subplot(1,3,1) plt.hist(a, bins=[1,5,10,15], align='mid') plt.title("MID") plt.subplot(1,3,2) plt.hist(a, bins=[1,5,10,15], align='right') plt.title("RIGHT") plt.subplot(1,3,3) plt.hist(a, bins=[1,5,10,15], align='left') plt.title("LEFT") plt.show() |
- orientation: Used for making a histogram 'horizontal' or 'vertical' [Default]
Consider the following code which generates Horizontal and Vertical histogram for the same data: 1 2 3 4 5 6 7 8 9 10 11 | import matplotlib.pyplot as plt a = [1,4,7,12,13,15] plt.subplot(1,2,1) plt.hist(a, bins=[1,5,10,15], orientation='horizontal') plt.title("HORIZONTAL") plt.subplot(1,2,2) plt.hist(a, bins=[1,5,10,15], orientation='vertical') plt.title("VETICAL") plt.show() |


mast he
ReplyDelete