CBSE CS and IP

CBSE Class 11 & 12 Computer Science and Informatics Practices Python Materials, Video Lecture

Showing posts with label Class 12 IP. Show all posts

MySQL Date Functions


MySQL Date Functions

For preforming the operations on dates, MySQL has provided some function:

1. NOW ()

NOW function returns the current date and time.

Syntax:
NOW( )

2. DATE ()

DATE function extracts the date value from a date or datetime expression.

Syntax:
DATE( expression )

Parameter or Arguments:
expression: The date or datetime value from which the date should be extracted.

3. MONTH ()

MONTH function returns the month portion of a date value.

Syntax:
MONTH( date_value )

Parameter or Arguments:
date_value: A date or datetime value from which to extract the month.

4. MONTHNAME ()

MONTHNAME function returns the full name of the month for a date.

Syntax:
MONTHNAME( date_value )

Parameter or Arguments:
date_value: A date or datetime value from which to extract the full month name.

5. YEAR ()

YEAR function returns the year portion of a date value.

Syntax:
YEAR( date_value )

Parameter or Arguments:
date_value: A date or datetime value from which to extract the year.

6. DAY ()

DAY function returns the day portion of a date value.

Syntax:
DAY( date_value )

Parameter or Arguments:
date_value: The date or datetime value from which to extract the day.

7. DAYNAME ()

DAYNAME function returns the weekday name for a date.

Syntax:
DAYNAME( date_value )

Parameter or Arguments:
date_value: The date or datetime value from which to extract the weekday name.


MySQL Text Function


MySQL Text Function

For preforming the operations on strings, MySQL has provided some function:

1. UCASE ()/UPPER () 

It converts all characters in the specified string to uppercase. If there are characters in the string that are not letters, they are unaffected by this function.

Syntax:
UCASE( string )

Parameter or Arguments:
string: The string to convert to uppercase.

2. LCASE ()/LOWER ()

It converts all characters in the specified string to lowercase. If there are characters in the string that are not letters, they are unaffected by this function.

Syntax:
LCASE( string )

Parameter or Arguments:
string: The string to convert to lowercase.

3. MID ()/SUBSTRING ()/SUBSTR () 

This function allows you to extract a substring from a string.

Syntax:
MID( string, start_position, [length] )
SUBSTR( string, start_position, [ length ] )
SUBSTRING( string, start_position, [ length ] )

Parameter or Arguments:
string: The string from which Substring is required.
start_position: The position to begin extraction. The first position in the string is always 1.
Length: The number of characters to extract

4. LENGTH ()

This function returns the length of the specified string (measured in bytes).

Syntax:
LENGTH( string )

Parameter or Arguments:
string: The string to return the length for.

5. LEFT ()

LEFT function allows you to extract a substring from a string, starting from the left-most character.

Syntax:
LEFT( string, number_of_characters )

Parameter or Arguments:
string: The string that you wish to extract from.
number_of_characters: The number of characters that you wish to extract from a string starting from the left-most character.

6. RIGHT ()

The RIGHT function allows you to extract a substring from a string, starting from the right-most character.

Syntax:
RIGHT( string, number_of_characters )

Parameter or Arguments:
string: The string that you wish to extract from.
number_of_characters: The number of characters that you wish to extract from a string starting from the right-most character.

7. INSTR ()

INSTR function returns the location of a substring in a string.

Syntax:
INSTR( string, substring )

Parameter or Arguments:
string: The string to search.
substring: The substring to search for in string.

8. LTRIM ()

LTRIM function removes all space characters from the left-hand side of a string.

Syntax:
LTRIM( string )

Parameter or Arguments:
string: The string to trim the space characters from the left-hand side.

9. RTRIM ()

RTRIM function removes all space characters from the right-hand side of a string.

Syntax:
RTRIM( string )

Parameter or Arguments:
string: The string to trim the space characters from the right-hand side.

10. TRIM ()

TRIM function removes all specified characters either from the beginning or the end of a string.

Syntax:
TRIM( [ LEADING | TRAILING | BOTH ] [ trim_character FROM ] string )

Parameter or Arguments:
LEADING: Optional. Removes the trim_character from the front of the string.
TRAILING: Optional. Removes the trim_character from the end of the string.
BOTH: Optional. Removes the trim_character from the front and end of string.
trim_character: Optional. The character that will be removed from the string. If this parameter is omitted, it will remove space characters from the string.
string: The string to trim.


MySQL Math Function


MySQL Math Function

MySQL provides different Mathematics functions to perform Math operations. In your syllabus we have to learn these three functions:

1. POWER ( ) or POW( ) 

The MySQL POWER function returns m raised to the nth power. (mn)
Ex:- 32 = 9

Syntax:
POWER( m, n ) OR POW( m, n)

Parameters or Arguments:
m: Numeric value. It is the base used in the calculation.
n: Numeric value. It is the exponent used in the calculation.

2. ROUND ( ) 

Returns a number rounded to a certain number of decimal places.
– Ex:- 12.265 rounded to 2 decimal points 12.27 .

Syntax:
ROUND( number, [ decimal_places ] )

Parameters or Arguments:
number: The number to round.
decimal_places: The number of decimal places to round. This value must be a positive or negative integer. If this parameter is omitted, the ROUND function will round the number to 0 decimal places.

3. MOD ( ) 

Returns the remainder of n divided by m.
– Ex:- 5 %  2  =  1 

Syntax:
MOD( n, m )  OR  n MOD m  OR  n % m

Parameters or Arguments:
n: Number.
m: Devisor.


CLASS 12 SAMPLE QUESTION PAPER SOLUTIONS (INFORMATICS PRACTICES) - 2020-21


CLASS 12 INFORMATICS PRACTICES SAMPLE QUESTION PAPER

Hello Everyone !!

Hope you are doing great. I have prepared a quetion-wise solution for cbse class 12 computer science sample question paper 2020-21. I have also discussed cbse class 12 computer science question paper pattern 2020. To download the question paper click here.

To check the video you can click on the below-given link. After going to the video you will find time in the description of the video where you can click to go to any question. 

Solution for Sample Question Paper - 2020-21

Customizing Matplotlib plots in Python - adding label, title, and legend in plots

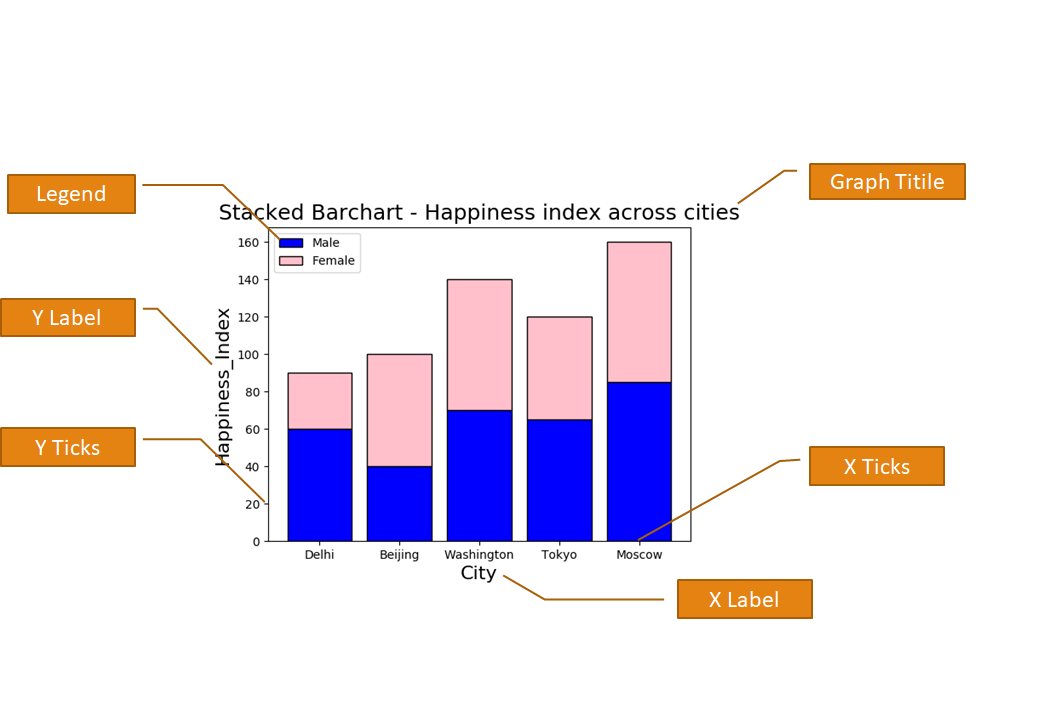
Anatomy of a Pyplot graph

You can customize your pyplot graph by giving different notations as given below in the diagram. Matplotlib's Pyplot interface provides many functions, which you can use to provide legend, X Label, Y Label, X Limit, Y limit, graph Title and many more. 
Pyplot  anatomy

X & Y Labels for the plot

X Label and Y Label represents X-axis and Y-axis Names. You can use plt.xlabel and plt.ylabel for giving the names to X and Y axis respectively. Here plt is an alias for matplotlib.pyplot .
 1
 2
 3
 4
 5
 6
 7
 8
 9
10
11
import matplotlib.pyplot as plt

x = [5,8,10]
y = [12,16,6]
plt.plot(x,y)

plt.title('Epic Info')
plt.ylabel('Y axis')
plt.xlabel('X axis')

plt.show()

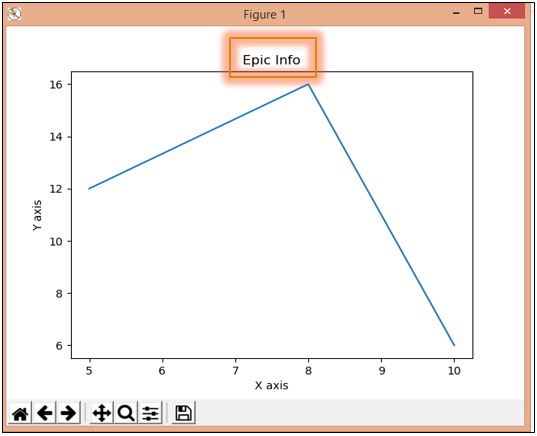
The above code will generate the following graph. In the above code, we have given name "X axis" and "Y axis" to X and Y axis respectively.
X & Y Labels for the plot

Title for the plot

The title provides the main heading to the graph. You can give Title using plt.title() function.
 1
 2
 3
 4
 5
 6
 7
 8
 9
10
11
import matplotlib.pyplot as plt

x = [5,8,10]
y = [12,16,6]
plt.plot(x,y)

plt.title('Epic Info')
plt.ylabel('Y axis')
plt.xlabel('X axis')

plt.show()

In this above code, I have provided Graph Title "Epic Info" so my Graph is showing Epic Info.  
matplotlib pyplot title

X & Y Limit for the plot

X-Limit and Y-Limit are used to provide the limit of numbers on X-axis and Y-axis. For this purpose xlim() and ylim() functions are used.
 1
 2
 3
 4
 5
 6
 7
 8
 9
10
11
import matplotlib.pyplot as plt

x = [5,8,10]
y = [12,16,6]
plt.plot(x,y)

plt.ylim(6, 16)
plt.xlim(5, 10)


plt.show()

The above code is giving X-axis limit from 6 to 16 and Y-axis limit from 5 to 10. You can see the output of the above code below. In this graph X-axis numbers ranging from 5 to 10 and Y-axis numbers are ranging from 6 to 16. 
matplotlib pyplot xlim ylim

X & Y Ticks for the plot

We can give the limits to X-axis and Y-axis using the above xlim and ylim function. But if we want to print only particular numbers on different axis we have to use xticks() and yticks() functions as shown below.
 1
 2
 3
 4
 5
 6
 7
 8
 9
10
11
import matplotlib.pyplot as plt

x = [5,8,10]
y = [12,16,6]
plt.plot(x,y)

plt.xticks([5,6,7,8,9,10])
plt.yticks([6,8,10,12,14,16])


plt.show()

In the above code, I am providing the numbers in the form of a list in the functions xticks() and yticks(). So, you can see that in the below-given graph X-axis is showing ticks only for 5,6,7,8,9,10 and Y-axis is showing ticks only for 6,8,10,12,14,16.
matplotlib pyplot xticks yticks

Adding Legend in the plot

Legend specify the use of different colours in our graph. As shown the graphgiven below Blue Color specifies the First Plot and Orange Color specifies the Second Plot.

<matplotlib.pyplot>.legend(loc="upper right")

values for loc:
"upper right" [Default]
"upper left"
"lower right"
"lower left"

Note: For legends you have to give label parameter in plot(), bar() or hist() functions.

matplotlib pyplot python legend


Saving the plot

A plot can be saved in our computer permanently by using savefig() function. This function helps us to save our generated graph permanently in our computer.
 
<matplotlib.pyplot>.savefig(<string with filename and Path>)

Note: 
  • If only the file name is given, save the fig in the current directory.
  • You can save figure in Popular Formats like (.pdf, .png, .eps etc) 


Data Visualization - Python Histogram (Using Pyplot interface of Matplotlib Library)

Histogram in Python

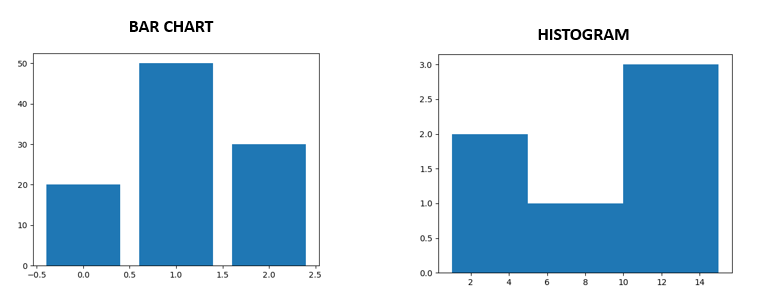
A histogram is a graphical display of data using bars of different heights. In a histogram, each bar groups numbers into ranges. 
  • Taller bars show that more data falls in that range. 
  • hist( ) function is used for generating histogram in Pyplot. 
python pyplot Histogram

Difference Between Bar Chart and Histogram

Difference between bar chart and histogram
Use of Histogram (by an example)

Use of Histogram with an Example
1
2
3
4
5
6
7
import matplotlib.pyplot as plt
n = [1,4,7,12,13,15]
plt.hist(n, bins=[1,5,10,15])
plt.show()

## Note: By default the bins will be divided automatically. 
## Python checks the lowest and highest values from the given numbers and divide in the equal size bins.

hist( ) function Prototype

<matplotlib.pyplot>.hist(x, bins = None, cumulative = Flase, histtype = 'bar', align = 'mid', orientation= 'vertical')

X: Array or sequence of arrays to be plotted on Histogram
bins: an integer or sequence, used to divide the range in the histogram
cumulative: True or False, Default is False
histtype: {'bar', 'barstacked', 'step', 'stepfilled'}, Default 'bar'
align: {'left', 'mid', 'right'}, default is 'mid'
orientation: {'horizontal', 'vertical'}, Default 'horizontal'

Explanation of Different parameters:

  • X (Data): Array or sequence of arrays to be plotted on Histogram

  • a) Single Array
    1
    2
    3
    4
    import matplotlib.pyplot as plt                  
    l = [1,4,7,12,13,15]
    plt.hist(l)
    plt.show()
    
    Find the output of the above program, all the bucket or bins taken by the Python by default.
    Python histogram: with single array
  • b) Tow or more than two arrays
    1
    2
    3
    4
    5
    import matplotlib.pyplot as plt
    a = [1,4,7,12,13,15]
    b = [10,14,17,2,3,11]
    plt.hist([a,b])
    plt.show()
    
    Since in the above program, we are providing two sequences here the Python will generated two histograms as below:
    Histogram using Two arrays

  • bins: an integer or sequence, used to divide the range in the histogram

  • a) Automatic bins: In the previous two examples you can see that I have not given bins parameter. Bin is dividing automatically.
  • b) Giving the bins Manually 
    i) Using Scalar Value
    1
    2
    3
    4
    import matplotlib.pyplot as plt                    
    a = [1,4,7,12,13,15]
    plt.hist(a, bins=5)
    plt.show()
    
    You can see I have given bins as 5, hence python will create 5 bins of equal size. 
    Histogram using scalar value for bin parameter

    ii) Using list
    1
    2
    3
    4
    import matplotlib.pyplot as plt                            
    a = [1,4,7,12,13,15]
    plt.hist(a, bins=[1,5,10,15])
    plt.show()
    
    In the above program, since we are giving bins as a list, hence now bins will be 1-5,5-10 and 10-15.
    bins parameter as list for python histogram

  • cumulative: To make a cumulative histogram, by default it is False

Cumulative mean accumulating the previous height of the bar, It can be either True or False, default is False. Till now we have seen all histogram with a default value of cumulative, that is with False. If we make the value of cumulative as True for the previous example: 
1
2
3
4
import matplotlib.pyplot as plt
a = [1,4,7,12,13,15]
plt.hist(a, bins=[1,5,10,15], cumulative=True)
plt.show()
The output will be like this:
cumulative Histogram in Python

  • histtype: This gives the style to the histogram.

    • 'bar' [Defaut]
    • 'barstacked': Used when providing two or more arrays as data
    • 'step': generate a line plot that is by default unfilled  
    • 'stepfilled': generate a filled line plot
Cosider the following example:
 1
 2
 3
 4
 5
 6
 7
 8
 9
10
11
12
13
14
15
16
17
18
19
20
21
22
import matplotlib.pyplot as plt
a = [1,4,7,12,13,15]
b = [11,14,17,2,3,12]

plt.subplot(2,2,1)
plt.hist(a, bins=[1,5,10,15], histtype='bar')
plt.title("bar")

##barstacked is used with two or more data arrays
plt.subplot(2,2,2)
plt.hist([a,b], bins=[1,5,10,15], histtype='barstacked')
plt.title("barstacked")

plt.subplot(2,2,3)
plt.hist(a, bins=[1,5,10,15], histtype='step')
plt.title("step")

plt.subplot(2,2,4)
plt.hist(a, bins=[1,5,10,15], histtype='stepfilled')            
plt.title("stepfilled")

plt.show()
Consider the following output containing all types of graphs in a single plot:
Histogram in Python

  • align: Used for Histogram bars alignment{'left', 'mid', 'right'}, default is 'mid'

It is used for bar alignment, consider the following code which is using all types of alignments.
 1
 2
 3
 4
 5
 6
 7
 8
 9
10
11
12
13
14
15
import matplotlib.pyplot as plt
a = [1,4,7,12,13,15]
plt.subplot(1,3,1)
plt.hist(a, bins=[1,5,10,15], align='mid')
plt.title("MID")

plt.subplot(1,3,2)
plt.hist(a, bins=[1,5,10,15], align='right')                  
plt.title("RIGHT")

plt.subplot(1,3,3)
plt.hist(a, bins=[1,5,10,15], align='left')
plt.title("LEFT")

plt.show()
The above code will generate following output:
align parameter in hist function

  • orientation: Used for making a histogram 'horizontal' or 'vertical' [Default]

Consider the following code which generates Horizontal and Vertical histogram for the same data: 
 1
 2
 3
 4
 5
 6
 7
 8
 9
10
11
import matplotlib.pyplot as plt
a = [1,4,7,12,13,15]
plt.subplot(1,2,1)
plt.hist(a, bins=[1,5,10,15], orientation='horizontal')           
plt.title("HORIZONTAL")

plt.subplot(1,2,2)
plt.hist(a, bins=[1,5,10,15], orientation='vertical')
plt.title("VETICAL")

plt.show()
this will generate the following output:
orientation parameter of hist function


Pandas Series dtype Parameter

Python Pandas Series dtype

USE OF DTYPE IN SERIES

dtype parameter is used to provide the data type to the Series elements. Since a single series can have a single data type, we can assign our own data type using dtype parameter. 

Series Method Prototype

In the previous posts we have seen data Parameter and index Parameter, in this Post we will discuss dtype Parameter. By default, the dtype will be inferred by Series elements.  

<Series Object> =  pandas.Series(data=None, index=None, dtype=None, name=None, copy=False, fastpath=False)

dtype can be:
  • If not specified, this will be inferred from data.
  • Any NumPy data type

a)  dtype - inferred from data

When we do not provide the dtype at the time of series creation it will automatically be taken by python from the data of Series. Check the following examples:

(i) Creating Series with NumPy array

In the following example, we are creating the series using the NumPy array. The data type of Series is coming as int32. This is taken by the python from the data because all the data are of integer type, hence "int32" was given as data type of Series.   

import numpy as np
import pandas as pd
arr = np.array([1,2,3,4])
print(arr)          
s = pd.Series(arr)
print(s)
print(type(s))

'''
Output:
-------
[1 2 3 4]

0    1
1    2
2    3
3    4
dtype: int32

<class 'pandas.core.series.Series'> 
'''

(ii) Using List

When we use list for the creation of Series, it takes the index of Series same as the index of the list. As shown in the example the list myList is shaving Three values, these values can be of any type. Here the list contains the string and integer both, hence the python has given the dtype as "object"
import pandas as pd
myList = ['A','B',2]
s = pd.Series(myList)
print(s)
print(type(s))

'''
Output:
-------
0    A
1    B
2    2
dtype: object

<class 'pandas.core.series.Series'>
'''

(iii) Using Dictionary

When a dictionary is used for Series creation, the values of that dictionary is used as data of Series and Keys are used as data labels (index) of Series. In this case, all the Series elements are integer, hence the data type is coming "int64".
import pandas as pd
d = {'A':1, 'B':2, 'C':3}
print(d)
s = pd.Series(d)
print(s)
print(type(s))

'''
Output:
------
{'A': 1, 'B': 2, 'C': 3}

A    1
B    2
C    3
dtype: int64

<class 'pandas.core.series.Series'>
'''

b) Any NumPy Data Type

At the time of Series Creation, we can provide our own data type using dtype Parameter. Following is the list of NumPy Data Type.

Data Type Description
bool_ Boolean (True or False) stored as a byte
int8 Byte (-128 to 127)
int16 Integer (-32768 to 32767)
int32 Integer (-2.15E-9 to 2.15E+9)
int64 Integer (-9.22E-18 to 9.22E+18)
uint8 Unsigned integer (0 to 255)
uint16 Unsigned integer (0 to 65535)
uint32 Unsigned integer (0 to 4.29E+9)
uint64 Unsigned integer (O to 1.84E+19)
float16 Half precision signed float
float32 Single precision signed float
float64 Double precision signed float
complex64 Complex number: two 32-bit floats (real and imaginary components)
complex128 Complex number: two 64-bit floats (real and imaginary components)

 1
 2
 3
 4
 5
 6
 7
 8
 9
10
11
12
13
14
15
16
17
18
19
20
21
22
23
24
import pandas as pd
import numpy as np
s = pd.Series(data = [1,2,3,4], dtype = np.int16)
print(s)

'''
#Output:
0    1
1    2
2    3
3    4
dtype: int16
'''

s = pd.Series(data = [1,2,3,4], dtype = np.float32)                
print(s)
'''
#Output:
0    1.0
1    2.0
2    3.0
3    4.0
dtype: float32
'''

In the above example, you can see that we have provided "np.int16" and "np.float32" respectively for the same data [1,2,3,4]. 

Pandas Series Index Parameter

PANDAS Series Method Index Parameter

Series Method Prototype:

<Series Object> = pandas.Series(data=Noneindex=None, dtype=None, name=None, copy=False, fastpath=False)

  • In this post, we are going to discuss index parameter.
  • To know how to use data parameters click here

The Series method gives the default indexes as 0,1,2 ....etc. In this post, I am going to discuss how to provide user-defined indexes using index Parameter of the Series Method. It is used to provide the data labels for data values. The number of indexes should be the same as the number of data values. The indexes can be provided in the following three ways:
  • The Index taken by Dictionary
  • Specifying Index Using List
  • Indexes with Scalar Data Value

a) The index taken by Dictionary

If we are providing the data in the form of a dictionary, then the keys of the dictionary will become the indexes and values of the dictionary will become data of the Series.
import pandas as pd
d = {'A':1, 'B':2, 'C':3}
print(d)
s = pd.Series(d)
print(s)
print(type(s))

'''
Output:
------
{'A': 1, 'B': 2, 'C': 3}

A    1
B    2
C    3
dtype: int64

<class 'pandas.core.series.Series'>
'''

b) Specifying Index Using List

We can provide indexes using a List, the number of elements in the list should be the same as the number of data values. As shown in the example below the index are X, Y and Z and the data elements are 1, 2 and 3.
import pandas as pd
l = [1,2,3]
s = pd.Series(data= l, index = ['X','Y','Z'])
print(s)
'''
Output
------
X    1
Y    2
Z    3
dtype: int64
'''

l = [1,2,3]
s = pd.Series(l, ['X','Y','Z'])
print(s)
'''
Output
------
X    1
Y    2
Z    3
dtype: int64
'''

Note: Length of Data and Index Should be same. Otherwise, Python will show an error.

c) Indexes with Scalar Value

If we are creating the Series with Scalar Value, then we can provide indexes in the form of a list. The total values in the Series will depend upon the number of elements in the index. For example, you can see the code below. In this code, the scalar value is "Hello" and there are three elements in Series s, because we have provided three indexes.    
import pandas as pd
s = pd.Series("Hello",[1,2,3])
print(s)

'''
#Output:
1    Hello
2    Hello
3    Hello
dtype: object
'''

For more Details Wath the following Video:

Pandas Series - A Pandas Data Structure (How to create Pandas Series?)

Pandas Series in Python
Series is a one-dimensional Data Structure of Pandas, it is used for data analysis. It can contain a heterogeneous types of values. Series type Object has two main components:
  • An array of actual data
  • An associated array of indexes or data labels
Pandas Series
Fig-1 Series

Like list, there are indexes in Series, but in series, we can assign our own indexes (Data labels). The labels need not be unique but must be a hashable type. 

How to create pandas series?

To create the Series Object a list of data to be passed in Series() Function. This function is available inside the Pandas Module. Hence before creating Series Object we have to import pandas library using:

import pandas

Following is the syntax for Series Creation:

<Series Object> = pandas.Series(data)
<Series Object> = pandas.Series(data=None, index=None, dtype=None, name=None, copy=False)

data: data parameter provides data for Series creation, it can be a Sequence or Scalar Value 
index: This is used to change the default index of Series
dtype: It is used to change the default datatype of Series 
name: To give a name to Series
copy: To copy input Data, A boolean Value by default is false

By default, the index of series will be integers starting from 0,1,2...etc. as shown above in Fig-1 Series.

Use of different types of Data

In Series Data Structure, we can use our own data for creating the series. This data can be of different types. 

<Series Object> =  pandas.Series(data=None, index=None, dtype=None, name=None, copy=False, fastpath=False)

The data can be:
  • Without Data (Empty Series)
  • A scalar value
  • A python sequence (ex:- list, tuple, dictionary etc.)
  • A ndarray
Let us discuss each one by one with Pandas Series Examples.

a) Without Data (Empty Series)

If we do not provide any data then python pandas will create an empty series. The default data type that pandas provide to series is "float64". In the following example, you can see that I have not provided any parameter in Series() function. This will create an empty series.
import pandas as pd
s = pd.Series()
print(s)         ## Series([], dtype: float64)
print(type(s))   ## <class 'pandas.core.series.Series'>


b) A Scalar Value

A Pandas Series can be created with only single Parameters. This will create a Series Object with only a single value. In the following example, you can see that I have provided a value 20 only. A Series Object 's' has been created by Pandas with value 20.  
import pandas as pd
s = pd.Series(20)
print(s)
print(type(s))

'''
## Output
-----------
0    20
dtype: int64

<class 'pandas.core.series.Series'>
'''


c) A python sequence (ex:- list, tuple, dictionary etc.)

A Python sequence can be used for the creation of Series Object. Any Python Sequence like list, tuple or dictionary can be used for this purpose. Next, we will create a series using List and Dictionary.

Using List: When we use list fr creation of Series, it takes the index of Series same as the index of the list. As shown in the example the list myList is shaving Three values, these values can be of any type.
import pandas as pd
myList = ['A','B',2]
s = pd.Series(myList)
print(s)
print(type(s))

'''
Output:
-------
0    A
1    B
2    2
dtype: object

<class 'pandas.core.series.Series'>
'''

Using Dictionary: When a dictionary is used for Series creation, the values of that dictionary is used as data of Series and Keys are used as data labels (index) of Series.
import pandas as pd
d = {'A':1, 'B':2, 'C':3}
print(d)
s = pd.Series(d)
print(s)
print(type(s))

'''
Output:
------
{'A': 1, 'B': 2, 'C': 3}

A    1
B    2
C    3
dtype: int64

<class 'pandas.core.series.Series'>
'''


d) A ndarray

Numpy is a core library for numerical and scientific computation. We can use a one-dimensional Numpy array for Series creation. The Index or data labels of Series will come as 0,1,2....etc. by default.
import numpy as np
import pandas as pd
arr = np.array([1,2,3,4])
print(arr)          
s = pd.Series(arr)
print(s)
print(type(s))

'''
Output:
-------
[1 2 3 4]

0    1
1    2
2    3
3    4
dtype: int32

<class 'pandas.core.series.Series'> 
'''